Check sheet
Introduction
In a manufacturing process scenario, we want to check whether all the required data have been collected and steps have been followed or not. It can be either to identify defects by type or location and so on. In simpler terms, we can say that to count the occurrence of problems. It can be of various forms which are applied on specific purpose keeping on the mind. For e.g. it can be in the form of checklists which lists down all the important events in a tabular format and keeps an update of occurrence of events. This helps us to understand the process and to keep track of defect patterns including the causes.
What is a Check sheet?
Basically, a check sheet is a form of the document for organizing and collecting data in a real-time process or in a location where the data is generated. The data we collected can either be qualitative or quantitative. When the data is quantitative, the check sheet is also called a tally sheet.
It is very important to understand which form is to use for the intended purpose and so we can make good use of it. Following are some of the usage of check sheets:
- Probability distribution of a process – To get the visualize form of the distribution of a process. It is a frequency distribution tally sheets which are used to create a histogram and so we can check the outlook of a process.
- Identification of defect type – Here we can categorize all the defects types and lists in the form of frequency distribution table. Then we can plot a bar chart to check the occurrence of defect types.
- Identification of defect by location – We can detect the defects in which location it occurs. It comprises of drawings, layout, or maps which show where is the defects are occurring.
Check sheet format (Design specification)
We can design in accordance with our requirement but we should keep in mind that it is well designed for the intended use. A well-designed check sheet answers the queries like a number of defects occurrence and locations, inspections have been completed or not, etc. Following are some of the common points which are included in the format are:-
- Name of the operator
- Types of data collected
- Location of data collection took place
- Data collection schedules
- Reason for collecting data and so on.
When to use check sheet?
- Data can be observed by the same operator.
- Data can be collected repeatedly by the same operator.
- Overview of frequency distribution w.r.t defects type, location, causes, etc.
- Data are collected from the production process line.
Benefits
- It is a basic quality tool and easy to demonstrate.
- Very useful in process improvement.
- It helps to make a better decision.
- Once Ishikawa has stated that “80 % to 90% problems will be solved in the workplace by using this simple tool”.
- It is a versatile tool which can be used in many domains like manufacturing, pharmaceutical, service sector and so on.
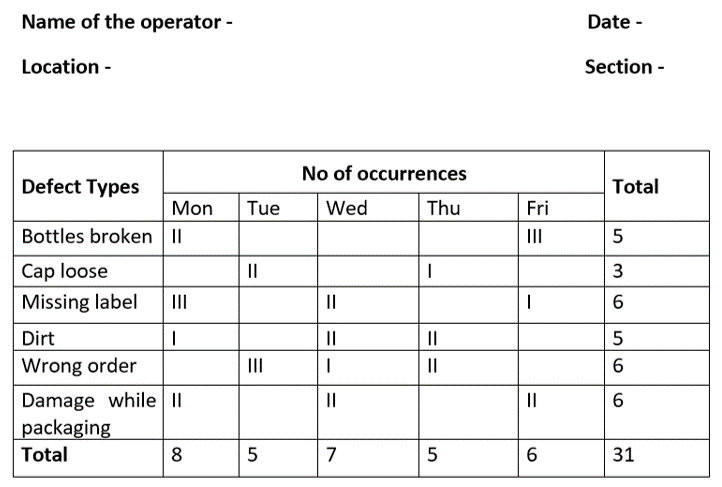
Example
Reference
A quality officer of a beverage manufacturing industry records the type of defect occurs during the production line. As the check sheet contains the name of the operator, date, location, defect types, number of occurrences and so on.
Attend our Training Program, to know – “How can we achieve Quality Excellence in an Organisation?” We conduct various training programs – Statistical Training and Minitab Software Training. Some of the Statistical training certified courses are Predictive Analytics Masterclass, Essential Statistics For Business Analytics, SPC Masterclass, DOE Masterclass, etc. (Basic to Advanced Level). Some of the Minitab software training certified courses are Minitab Essentials, Statistical Tools for Pharmaceuticals, Statistical Quality Analysis & Factorial Designs, etc. (Basic to Advanced Level).
We also provide wide-ranging solutions for Enterprise Quality Management to achieve Organisational Excellence.