Lean Six Sigma
Let’s discuss the origin of Lean and Six Sigma.
Lean – There were many evolution phases about the origin of lean. It leads back to “Ford’s Assembly Line” and “Toyota Production System (TPS)”. It was popularly introduced to the World in 1990 as “Lean” through the book titled “The Machine that Changed the World“ by Daniel Roos, Daniel T. Jones, and James P. Womack.
Six sigma – It was first introduced in 1980 at Motorola by Bill Smith and Dr. Mikel Harry. It was used to reduce the number of defects to 3.4 units/every one million units. They worked together to come up with “DMAIC” – which became the key concept to the implementation of successful Six Sigma projects.
Lean Six Sigma – It was introduced in 2002 through the book titled “Lean Six Sigma: Combining Six Sigma Quality with Lean Production Speed” by Michael George. Since then it has been popular worldwide with its concept and applications.
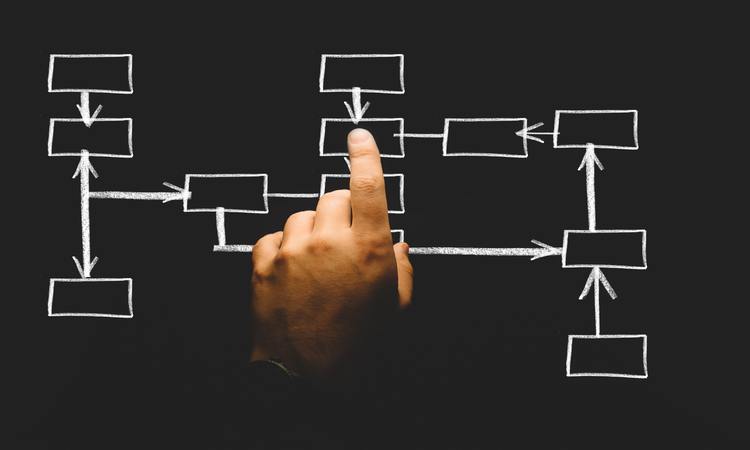
Waste is any activity that doesn’t add value to a process or a service but it consumes time and other resources. There are eight areas from where wastes are produced and Lean Six Sigma focus on minimising it. To remember the eight wastes, we can use the acronym “DOWNTIME”.
- Defects – It leads to rework, scrap and eventually loss of time & resources by involving in wasteful activities. More defects mean more waste. Similarly, fewer defects mean less waste.
- Overproduction – Producing more products or services that are needed. Thus overproduction leads to trash.
- Waiting – Idle time or delay created by waiting for the next process step. For e.g. during a process hours labours are waiting for raw material and other resources.
- Non Utilized Talent – When an employee has the potential to do tasks but management fails to utilize it. It means failing to utilize employees talent, skills and knowledge.
- Transportation – Moving products or materials unnecessarily from one place to another. Thus adding no value to the products or services.
- Inventory – Excessive products or materials are stores than required. For e.g. equipment or materials are kept idle without usage.
- Motion – Extra steps taken by personnel which don’t add value to a process. And it could be either machine or parts which are doing unnecessary movements.
- Extra Processing – Doing additional processing i.e. beyond customer’s requirement and don’t add value to product or services. It costs extra money and resources.
Lean Six Sigma is implemented to detect a process variation and to minimise it for better quality assurance. Thus we could detect trends or changes in the process before they produce non-conforming product and scrap.
Variation can be divided as common cause variation and special cause variation.
- Chance causes are also known as random or natural or common causes. It is due to the natural variation of the process; i.e. Variation due to the way the process was designed and we cannot identify. For example, the fuel efficiency of machine varies slightly; the diameter of a bottle cap varies slightly and so on. (Statistically in control)
- Assignable causes are also known as special or non-random or unnatural causes. Causes can be identified and eliminated – poor employee training, equipment nonfunctional, etc. An example of special cause variation is the variation that might result if someone untrained is allowed to work in the process. (Out of control)
DMAIC – It consists of five phases in order.
- Define – This is the initial phase of DMAIC methodology. Here we need to define our goal and objectives as per the voice of the customer. Define the key elements which would boost the project. We conduct a Gemba walk and use SIPOC – high-level process mapping on this phase.
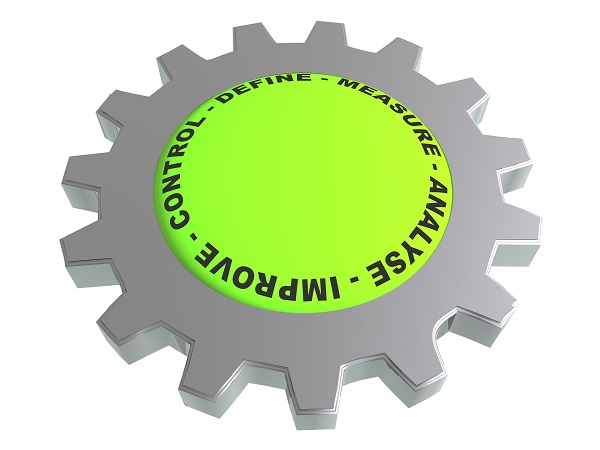
- Measure – During the Measure phase of the project, measurement of collected data of ongoing processes need to be done with intent to meet the goal. Measurement system analysis (MSA) and Value stream mapping are applicable here. Then determine the Process Capability for creating a baseline for a process.
- Analyze – On this phase, we need to determine the possible causes of variations and defects by performing Root Cause Analysis. And also identify the type of waste generated. We would use hypothesis testing and Design of Experiment.
- Improvement – After knowing the possible causes of variation, we would move to Improvement phase. Here, we would implement the Improvement methods
by doing pilot study and conduct FMEA. Some of the tools used in this phase are 5S,
Kaizen, etc. - Control – This is the final phase of DMAIC methodology. Here, we monitor the process
for continuous improvement by implementing Statistical Process Control. Prepare
documentation of the improved process and initiate the control plan for it.
- Gemba – It was introduced in the Toyota Production System and the term “Gemba” means actual place. It could be anywhere. For e.g. manufacturing floor, hospitals, administrative offices, etc. Here, we collect information about the process by observing it from the ground floor. Suppose, a senior executive would visit the manufacturing floor and understand the scenarios by observing and interacting with the workers. By doing so we could resolve some common queries – “What are the causes behind the process?”, “How it is occurring?” , “Are the employees satisfy with the management process?” By implementing it properly, an organization would have a different perspective on the process and customers.
- SIPOC – It is a high level mapping which gives the overview of initial inputs to the final outputs of a process. It stands for
- Supplier – Those who supply the inputs in a process.
- Input – Resources that are added to a process by the Suppliers.
- Process – A set of steps required to convert Input to Output.
- Output – Resultant or outcome of a process.
- Customer – Those who receives an output (Product or service) of a process.
- Value Stream Mapping (VSM) – It helps to reduce waste and increase efficiency in a process. It is a pictorial tool that represents the process scenarios like the flow of a product and development, identify wastes and highlight flaws which affects the process. By using VSM, we can have better insights into a process and gain different perspectives about the process flow. It displays all the important steps of a process which are required from initial to final phases of products or services. Thus brings clarity in a process.
- Sampling – It is a method used in statistical analysis of a data where a specific number of samples are taken from a population for a study. In the case of an infinite population, it is not possible to do on the whole population. In such cases, a sample study is the only applicable method. For e.g. a manufacturer industry wants to check the quality of a product. It is not possible to check on each and every item it manufactured. So we will take some part of it for inspecting the quality.
- Hypothesis Testing – Suppose we got just a sample data from the population. Based on the sample data, we need to make an inference for a population. For example, the manufacturer wants to check the product’s quality meets the pre-specified criteria. Basically, it draws an inference about the sample data w.r.t to population parameters.
- Process Capability – Suppose in a manufacturing process or any process, we often required information about the process w.r.t its performance or capability. Basically, it refers to the capability of a process to meet customer requirements or industrial standards on a consistent basis. It can be measured by Cp and Cpk.
- Cp – It is often described as the capability of a process when the process data is centred and specification limits are known.
- Cpk – It is described as the capability of a process when the process data is not centred and only one of the specification limits are known.
- 5S (Workplace Organization) – It is a key component to organize workplace. By implementing it, we could reduce waste, increase safety and make efficient flow in a process. The 5S are –
- Sort – To make arrangement of resources which are needed in a workplace and to remove the unnecessary one.
- Straighten – To prepare a specific location where we can keep resources and so it will easier to maintain it.
- Shine – To maintain cleanliness in workplace by cleaning equipment, storage and so forth. By doing so, we can reduce waste and improve efficiency.
- Standardize – There should be some sort of standards in a workplace to conduct 5s. So that everyone would involve in a process.
- Sustain – To be consistent in fulfilling the previous steps and thus maintain the same flow from beginning till the end of a process.
- KAIZEN – The term ‘KAIZEN’ means Continuous Improvement. And this Improvement could be in process, products, services, personnel, etc. It includes everyone in a process starting from ground level workers to top level executives in a continuous improvement environment. The main purpose to implement KAIZEN is to improve productivity, eliminate non-value added activities (waste) and make a continuous flow in a workplace. It works on “PDCA Cycle”.
- Plan – Plan for improvement by setting goals and gather possible information about a process.
- Do – Execute the plan; involve everyone and it leads to appropriate results.
- Check – Examine the results and we would come to know how effective our plan.
- Act – Take action based on above results i.e. to implement it or not.
- Failure Mode Effect Analysis (FMEA) – It helps to identify problems that may arise using the improved process. Failure modes are the way in which a process can fail. Effects are the impact on a process as a result of failure. It evaluates the severity, occurrence and detection of risks in a process. There are two types of FMEA.
- DFMEA (Design Failure Mode Effect Analysis) – It finds out the product malfunctions, safety and regulated concerns arises from design parameters like tolerances limits, material and so on.
- PFMEA (Process Failure Mode Effect Analysis) – It explores the factors which impacts process quality arises from 6 Ms (Men, Methods, Material, Machine, Measurement and Mother Nature).
It was introduced by Kaoru Ishikawa (renowned Japanese Professor). He pioneered quality control activities in Japan. With the usage of these basic tools, 95% of variation could be eliminated from a process.
- Check sheet – It is a form of the document for organizing and collecting data in real time process or in a location where the data is generated. It helps us to understand the process & to keep track of defect patterns including the causes.
- Pareto chart – It is a special type of chart which combines both bar graph and a line graph to represent the factors which are affecting the variable. Highlights the most frequently occurring defects & used to determine priorities for quality improvement.
- Histogram – It is a pictorial representation which displays the data value in bars. It gives an easy understanding of a process line.
- Scatterplot – It is a simple graph where the data of two continuous variables are plotted against each other. It helps to identify the strength of the relationship between two factors & their cause and effect relationship.
- Cause and effect diagram – Also popularly known as Fishbone diagram. It is a tool to explore the causes and to display as many as possible causes that might be creating a problem.
- Control Chart – It is a graph which displays all the process data in order sequence and detects variation in a process. It prevents us from manufacturing defective product.
- Stratification – It is a method to divide the data into categories or groups (homogeneous kind). It helps to identify the source of variation from which categories of data and reduction in sampling error.