Statistical Process Control (SPC)

During the 1920s, Walter A. Shewhart discovered a way to distinguish between common and special causes of variation in a process. This lead to an invention of the widely known method as statistical process control (SPC). He pioneered the use of statistical techniques for monitoring and controlling quality. Bell Labs wanted to economically monitor and control the variation in the quality of components and finished products. He recognized that inspecting and rejecting or reworking product was not the most economical way to produce a high-quality product. He demonstrated that monitoring and controlling variation throughout production was the more efficient and economical way.
Shewhart developed a visual tool for monitoring process variation, which came to be known as the control chart or the Shewhart control chart and the concept of a state of statistical control in 1924 at Bell Laboratories.
He has defined chance and assignable causes as the two sources of quality variation. A process that is operating with the only chance cause of variation is said to be in statistical control. A process that is operating with the assignable cause of variation is said to be out of control. The underlying concept of the Shewhart chart is to construct its limits based on variation allowable as it is in – control state and monitor the quality of the product produced.
Bell Labs was widely recognized as the ‘international standard for quality’ by the 1930s, due to the large applications of Shewhart’s techniques in the field of telecommunications. During this period, many initiatives were done by conducting extraordinary research in statistical methods to control and improve process variation. This leads to improve product quality in a great way.
His work was summarized in his books titled “Economic Control of Quality of Manufactured Product” (1931) and “Statistical Method from the Viewpoint of Quality Control” (1939).
Image – Referred from leansixsigmadefinition.com

SPC was pioneered by Walter A. Shewhart in the 1920s. W. Edwards Deming applied SPC methods in the United States during World War II, to improve quality in the manufacture of weapons and other important products needed during the war period. After the devastating defeat of Japan in World War II, the United States led the Allies in the occupation and rehabilitation of the Japanese state. In 1947, Deming was involved in early planning for the 1951 Japanese Census. The Allied powers were occupying Japan, and he was asked by the United States Department of the Army to assist with the census. Deming was also instrumental in introducing SPC methods to Japanese industry after the war had ended.
Deming’s mastered the Shewhart’s ideas by implementing it to Japanese industry from 1950 onwards. He developed and added some of his techniques to Shewhart’s methodology. Later he named as the ‘Shewhart cycle’. Deming’s approach to quality management results in continuous improvement of the production process to achieve conformance to specifications and reduce variability. He identifies two primary sources of process improvement: eliminating common causes of quality problems, such as poor product design and insufficient employee training, and eliminating special causes, such as specific equipment or an operator.
He was widely known for his work contribution for Japanese industry and for the new development era. He received an invitation from the Japanese Union of Scientists and Engineers (JUSE) and worked as an expert to teach statistical control. He trained hundreds of engineers, managers, and scholars in SPC and concepts of quality.
During the 1960s and 1970s, SPC grew rapidly in Japan and was a successful in quality improvement goals. Later other countries started implementing SPC in their process.
His work was summarized in his books titled “Out of the Crisis” (1982–1986) and “The New Economics for Industry, Government, Education” (1993), which includes his System of Profound Knowledge and the 14 Points for Management.
Image – Referred from census.gov
Statistical process control also termed as SPC is a statistical method used to monitor, control and improve processes by eliminating variation from industrial, actuarial, service and many other processes. Here we can determine if an improvement is actually happening and also use them to predict whether it is statistically capable to meet the specific target or not. The main aim of using SPC is to understand where the focus of works needs to be done in order to make a difference. It has now been incorporated by organizations around the world as a primary tool to improve product quality by reducing process variation.
During the initial phase, the SPC was applied only on manufacturing industries for quality improvement and so on. As time evolves by, it was started applying on service industry such as airlines, hospitals, insurance companies, etc. Now on this advanced age of science and information technology, it has started applying on big data analytics to artificial intelligence and much more to advance.
SPC involves following phases of activity –
- Collection of data from a process.
- Identification of causes and to eliminate it.
- Track process variation.
- Diagnosing the deviated process.
- Implementing corrective action.
(We use basic quality tools on these phases)
SPC is implemented in industry to detect a process variation and to eliminate it for better quality assurance. By monitoring the performance of a process, we can detect trends or changes in the process before they produce non-conforming product and scrap. [By reducing variation]
Variation can be divided as common cause variation and special cause variation.
- Chance causes are also known as random or natural or common causes. It is due to the natural variation of the process; i.e. Variation due to the way the process was designed and we cannot identify. For example, the fuel efficiency of machine varies slightly; the diameter of a bottle cap varies slightly and so on. (Statistically in control)
- Assignable causes are also known as special or non-random or unnatural causes. Causes can be identified and eliminated – poor employee training, equipment nonfunctional, etc. An example of special cause variation is the variation that might result if someone untrained is allowed to work in the process. (Out of control)
- To have an overall glimpse of a process.
- Monitoring a process to check whether it is under control or out of control.
- To track variation and to eliminate it from a process.
- Improvement in process capability aspects.
- To increase production by reducing scrap, rework and inspection cost.
- Early detection of variation in a process.
- Establish a consistent level of quality.
- Continuous improvement in a process by reducing variation.
- Helps in decision making by giving the insights of process.
- Reduce or eliminate the need for inspection during the supply chain.
- Lower investment because of process improvements.
- It provides real time analysis of a process and so we can focus on areas needed for improvement.
- Efficiency in data entry, analysis and reporting.
It is one of the primary tools in SPC. Suppose in a manufacturing process or any process, we often required information about the process w.r.t its performance or capability. Basically, it refers to the capability of a process to meet customer requirements or industrial standards on a consistent basis.
Measures of Process Capability – Process capability can be measured by the following methods.
- Process capability Ratio (Cp) – It is often described as the capability of a process when the process data is centred and specification limits are known.
It is given by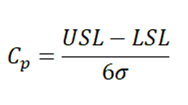
where,
USL -> Upper specification limit
LSL -> Lower specification limit
σ -> Process standard deviation
- Process capability index (Cpk) – It is described as the capability of a process when the process data is not centered and only one of the specification limits are known.
It is given by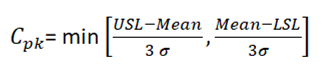
Some important considerations
- When Cp=Cpk –> process is centered at the midpoint of specifications.
- When Cp>Cpk –> process mean is nearer to one specification limit or the other.
- When Cp< 0 –> process mean lies outside the limit.
Example
In a piston manufacturing industry, quality engineers want to assess the process capability. They collect 25 subgroups of five piston rings and measure the diameters. The specification limits for piston ring diameter are 74.0 mm ± 0.05 mm.
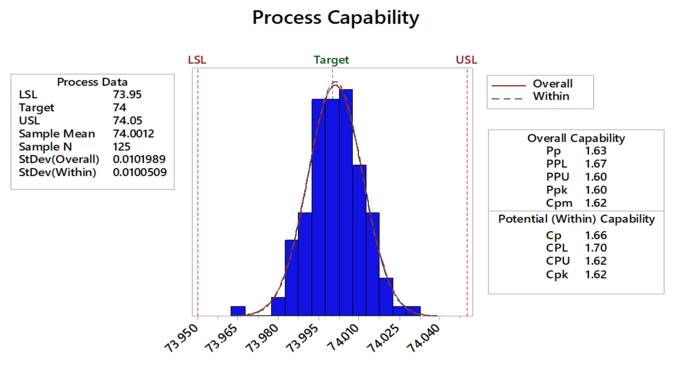
Interpretation
All the measurements are within the specification limits. The process is on target and the measurements are approximately centred between the specification limits.
Control limits – Control limits describe the behaviour of a process which operates in a normal condition. It is basically a horizontal lines drawn on a control chart to examines the outlook of a process. It consists of UCL (Upper control limit), CL (Control limit) and LCL (Lower control limit). If the points lie beyond the limits, then there is an occurrence of a special cause of variation and henceforth.
Specification limits – Specification limits are the values on which the process should give a response within the range. It is based on customer requirements. It can be a plot in a histogram and consists of USL (Upper specification limit) and LSL (Lower specification limit).
Control limits reflect the real capability of a process whereas specification limits reflect the requirement of a customer. A process under control may not deliver the products under the given specifications.
In this competitive world, every industry wants to be better than others and to achieve the highest level of success. Suppose it can be in the quality field, continuous improvement in a process, efficient productivity and so on. To achieve this level of success, SPC plays an enormous role in a company and there are some of the challenges one may face while implementing SPC.
Some of them are:-
- Lack of effective training – Training is an important factor for the successful implementation of SPC. Proper training should be given to all the employees who work on a ground level to topmost level in a process.
- Lack of basic statistics knowledge – One should have basic knowledge about statistics. So they can relate the background of SPC methods. Suppose if they were using the histogram in a process then they should have basic knowledge about it.
- Responsibilities should be properly defined – Starting from operators to engineers; everyone should have a clear picture of their responsibility in a process. Engineers should have the basic statistical concepts in SPC whereas operators should be good in measurement and plotting it.
- Management immense support – Elite members of a company should encourage all the employees in all the levels. Management should give time to implement SPC in a proper way. They should never carry away with the time and cost it took to implement it. And nevertheless, wait for its result. Hard work always paid off.
 Statistical process control methods are applicable to various sections of methodologies.
Some of them are discussed below.
- DMAIC – It is a well-known Six Sigma methodology and focused on improving the process. DMAIC stands for Define Measure Analyze Improve and Control. SPC is widely used in Measure, Analyze and Control phases. During the Measure phase, it is used to set the process baseline by doing control chart analysis and Capability analyses are done to check the capability of a process to meet specifications. During the Control phase, it is used to monitor and improve the process.
- PDCA/PDSA – These are the popular methodologies used in lean manufacturing. PDCA stands for Plan Do Check Act and was pioneered by Walter A. Shewhart. PDSA stands for Plan Do Study Act (Modified version of PDCA) and was modified by Dr. Edward Deming. The three main components
are specification, production and inspection. And SPC plays a major role in the specification part.
To enhance success in lean manufacturing, six sigma and lean six sigma projects, SPC has to be properly used. Apart from these scenarios, we can use SPC tool individually to check the process capability for continuous improvement. Also, prove useful while conducting DOE in a process.
In this competitive world, every industry has to compete with each other in terms of quality, production, revenue and so on. The main terminology which satisfies customer needs is “quality” which defines the company standard and values.
Within an organization, when TQM has implemented it helps for continuous improvement of process and gives consistently high-quality products. Total Quality Management is defined by the Deming Prize Committee as
- set of systematic activities
- carried out by the entire organization to effectively and efficiently
- achieve the organization’s objectives
- so as to provide products and services
- with a level of quality
- that satisfies customers ,
- at the appropriate time and price.
Statistical process technique (SPC) is a method used in TQM framework for detecting and reducing variation in a process. It is a very powerful method to detect, control, analyze and improve the process by reducing the source of variation. Hence SPC contributes a lot in TQM goal of continuous improvements.
Statistical process control also termed as SPC is a statistical method used to monitor, control and improve processes by eliminating variation from industrial, actuarial, service and many other processes. When an organization first uses SPC, the main objective is to ensure that the process is stable and capable of producing product or services to the expectations. It is widely known as a decision-making tool.
During the initial phase of SPC, it was used in discrete manufacturing (Telecom, Defense, Automobiles, etc.) and later it was applied to process manufacturing (Glass, Pharmaceutical, Beverage, etc.) too. It is widely used in almost all manufacturing processes for achieving process stability to continuous improvements in product quality.
But in recent years, SPC has implemented in various service sectors like healthcare, financial institutions, call centres, hotels, etc. The service industry has been an integral part of our life. They offer services which are very essential to us – starting from health care, airlines, call centres, banks and so on. For e.g. we often travel to various destinations for official work on holidays by air and stay in a hotel. When we travel by particular airline and didn’t get the essential services – Will we travel again from that airline? Similarly, when we stay at a particular hotel and didn’t get the required services – Will we stay again at that hotel? Our answer will be no, never. So maintaining healthy growth and improving the service quality will have significant impacts on us. And also excellent service quality is noted as a major factor to make a profit in the service sector.
Some of the examples are:-
- Healthcare – While implementing SPC we can improve patient care by reducing waiting time, and monitoring clinical trials, operational performance and so on.
- Banking – While implementing SPC we can improve customer service by reducing waiting time, % errors in customer profile, etc.
- Customer service – While implementing SPC we can improve customer service by reducing the call waiting time, monitoring the response calls, identification of a process whether it is under time limit or not, etc.
In a can-filling process, the quality engineer wants to know whether the process is in control or not. Each hour, they collect a subgroup of 10 cans. To minimize the variation (within subgroup), they collect the cans for a given subgroup in a short period of time.
They create an X-bar chart to monitor the weight of the cans.
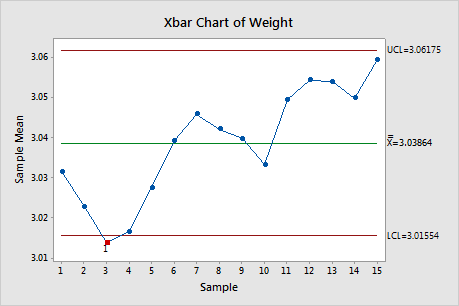
Interpretation
With reference from the X-bar chart, one point is out-of-control and they conclude that the process is not stable. Hence the process should be improved.